Are you struggling to get the most out of your reporting in Microsoft Dynamics 365? You’re not alone!
Many organisations have a hard time fully leveraging the powerful reporting capabilities in Dynamics 365. But it doesn’t have to be that way.
Whether you’re a D365 expert or just getting started, we’ll break down some tips and best practices for you to get better reporting from Dynamics 365. These tips will not only help you unlock the full potential of Dynamics 365 but also gain valuable insights into your business performance.
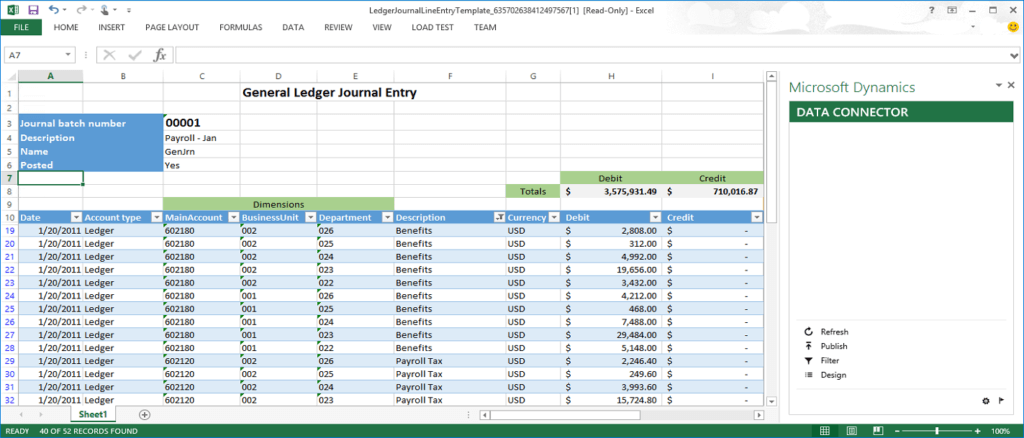
1. Utilise Excel exports and templates
You can also easily export data in Excel from Microsoft Dynamics 365 for additional calculations and analysis. Using Excel, you can create pivot tables, graphs, and charts to visualise reports.
For instance, you can create an Excel template for your weekly leads, including formulas for lead nurturing costs and forecasting or visualise the average cost of a sale based on sites or staff through pivot tables and graphs.
Dynamics 365 also has pre-built Excel templates to give you a head start.
2. Use FetchXML and SQL server reporting
Use Report Wizard to use FetchXML queries and the Report Authoring Extension for retrieving data from your database. While admin users can easily handle basic FetchXML-based reports, you will need developers to build custom reports.
But the XML-based reports do come with their own limitations:
- A query result can return a maximum of 5,000 records
- The maximum instances of duplicate detection rules per CRM entity is 5
- Reports cannot source data from an extra database outside Dynamics 365
- Scheduling reports is not possible, and they only run on-demand
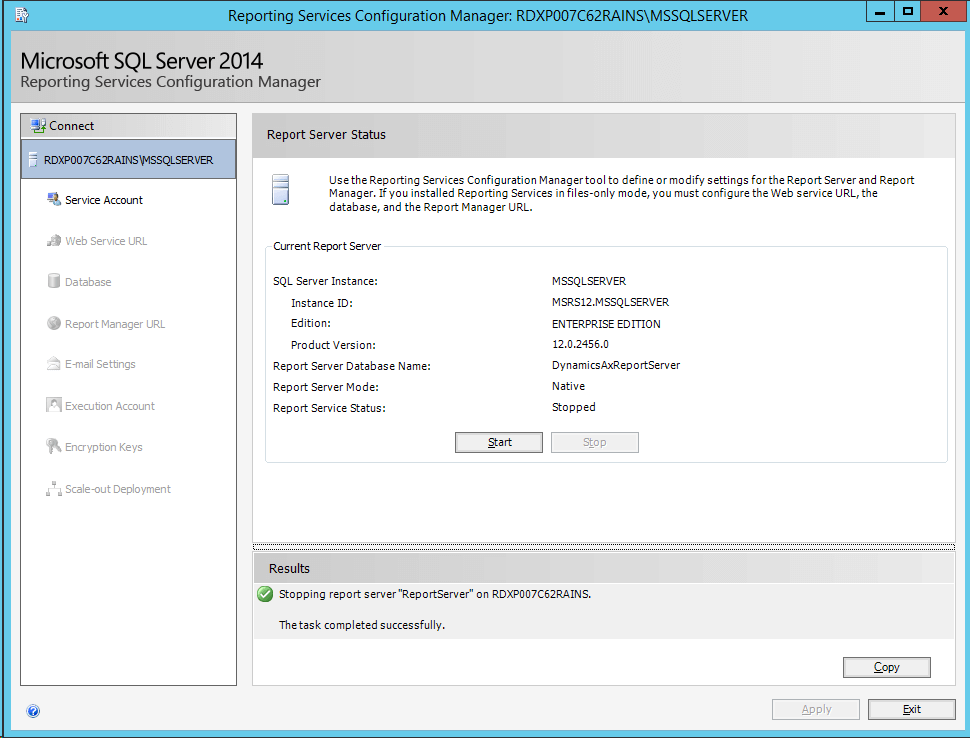
To overcome the limitations of FetchXML use SQL server reporting services (SSRS). SQL-based reporting allows developers to write custom reporting codes outside of the D365 environment but run them inside D365. The outcome is a broad range of reporting capabilities with customisations and visualisations.
SSRS reports enable you to report leads and quotes simultaneously with product information, for instance. This means you can easily report across multiple records, accounts, and products.
3. Try built-in reporting features and tools
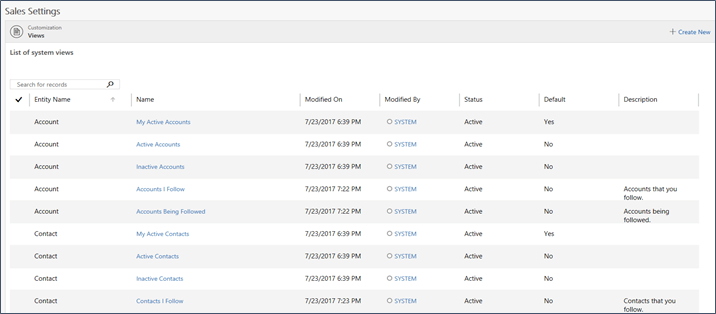
Dynamics 365 also comes with many built-in reporting features and tools that help you create powerful and highly customisable reports.
Its filters and sorting options allow you to narrow down data in reports and focus on relevant information. You can also use calculated fields to display end results in your reports.
Likewise, advanced reporting features, like sub-reports and drill-through functionality, provide more detailed information.
Sub-reports help generate detailed reports within a larger report to provide more context and information. Drill-through functionality enables you to drill down into specific data points to view more detailed information.
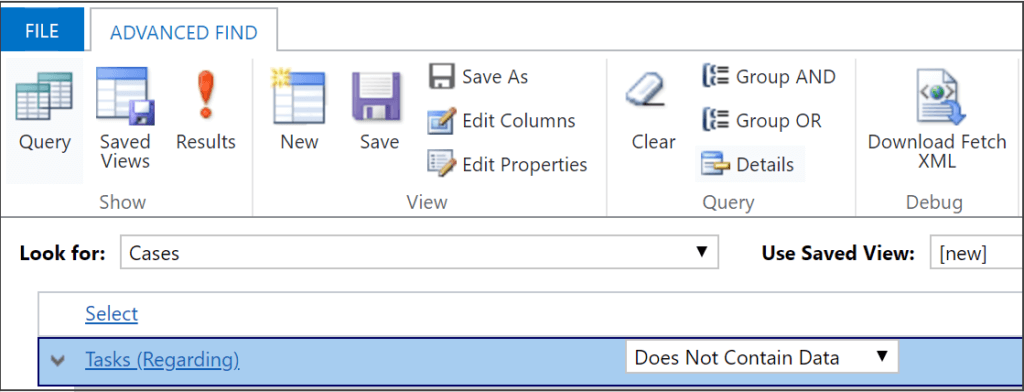
The built-in Advanced Find allows you to create custom reports based on specific criteria and data fields. You also have Views, which allows you to slice your data simply and flexibly. It is the easiest reporting feature that allows you to display desired fields from datasets.
For instance, you can view a list of accounts with won opportunities of over £250,000 and further filter it down based on location with a list of account managers working nearby.
4. Use data visualisation tools
In addition to reporting features, Dynamics 365 also offers several intuitive data visualisation tools to display data. This makes it easy to understand and interpret complex data and trends.
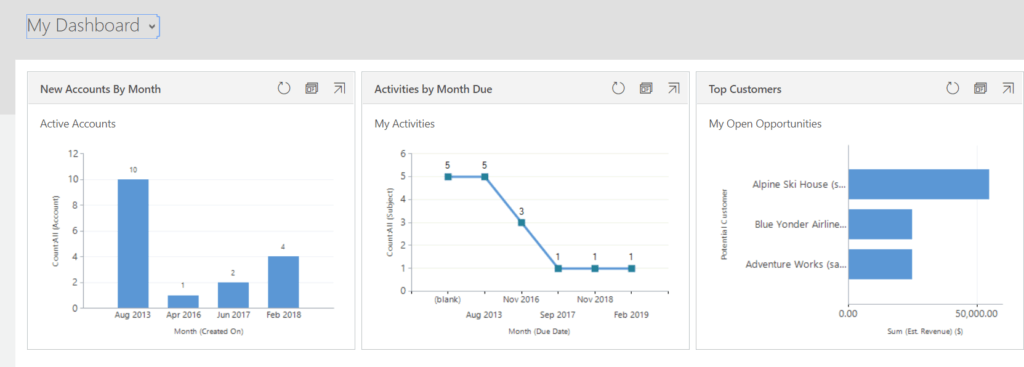
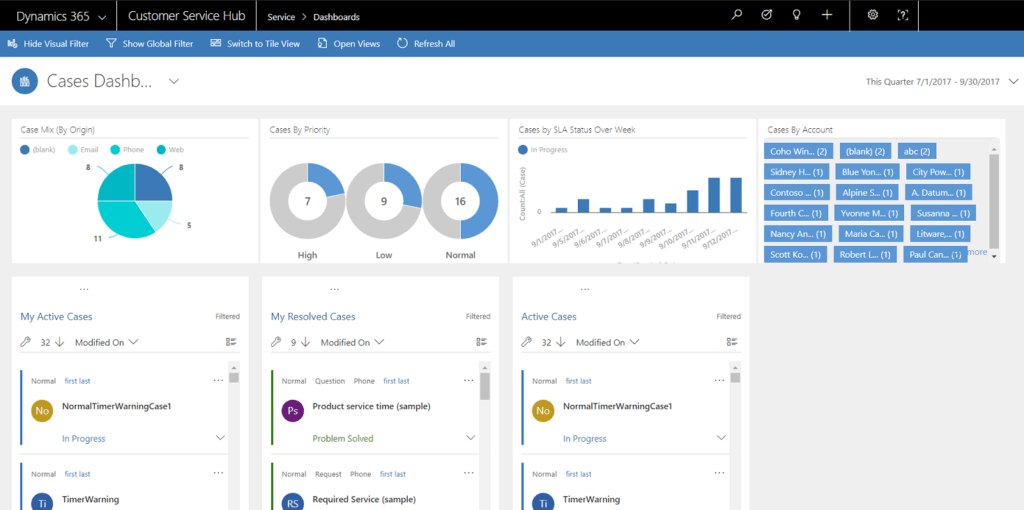
Use Chart Designer to transform large volumes of data into charts and graphs to aggregate data and communicate it effortlessly and quickly. For more advanced reporting and analytics, you can rely on interactive dashboards, which provide a unified view of key data, key performance indicators, and business insights in real-time.
5. Implement role-based security
As a cloud-based solution, Dynamics 365 provides flexible access to your data. But with role-based accessibility rules, you can ensure that only the authorised staff can view your reports. You can also effortlessly define who can edit, view, or share data and reports.
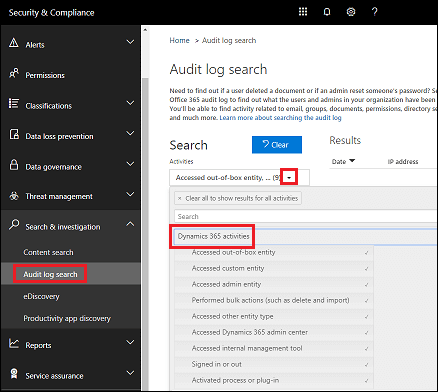
What’s more, the embedded Audit Log feature helps you track all the changes and analyse user activities, so you’re always able to monitor what’s happening in real-time.
This helps avoid data duplication and errors while maintaining the accuracy and integrity of your business data and reports.
6. Power BI
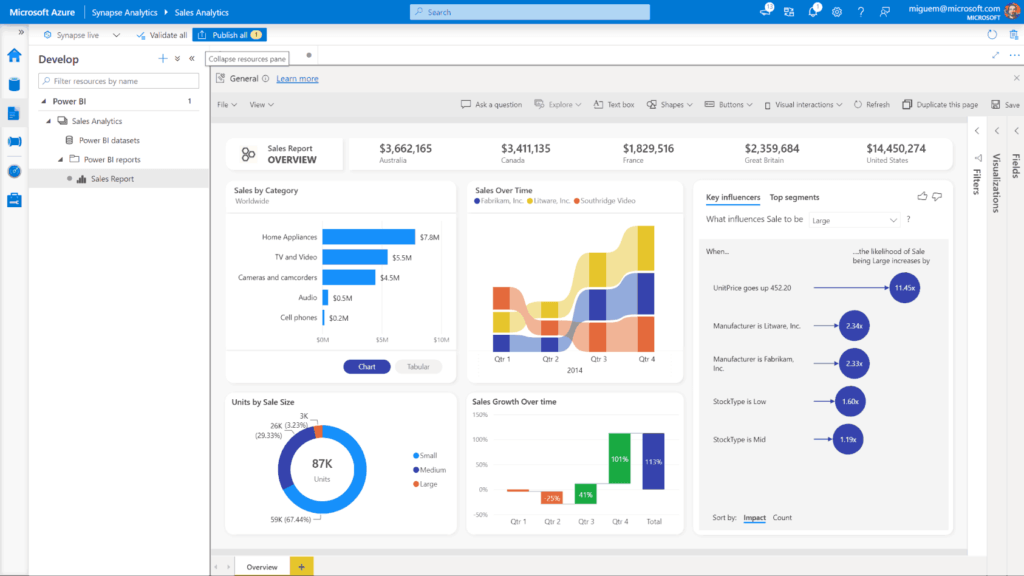
Power BI is a standalone reporting tool from Microsoft that offers the flexibility of charts and the power of SQL with seamless integration with Dynamics 365 and external data sources.
It has the collective power of automation, self-service, Excel and SharePoint integration, AI and ML. This means you get seamless connectivity, predictive analytics, and business intelligence capabilities from a single platform.
Additionally, Dynamics 365 can directly integrate and embed interactive Power BI dashboards on its UI. This way, you can not only filter, calculate, and visualise data, but also adjust fields and filters of the data source for immediate reporting and visualisation. What helps even more is Power BI can source data from Dynamics 365 as well as external datasets and combine them together in a single report.
This allows you to turn Dynamics 365 data into powerful, actionable insights that you can quickly use at every level of the organisation to enable data-driven decision-making. Plus, it offers self-service analytics with flexible scalability for D365 users at all levels so that everyone is empowered to make informed decisions.
7. Explore the benefits of Power Automate
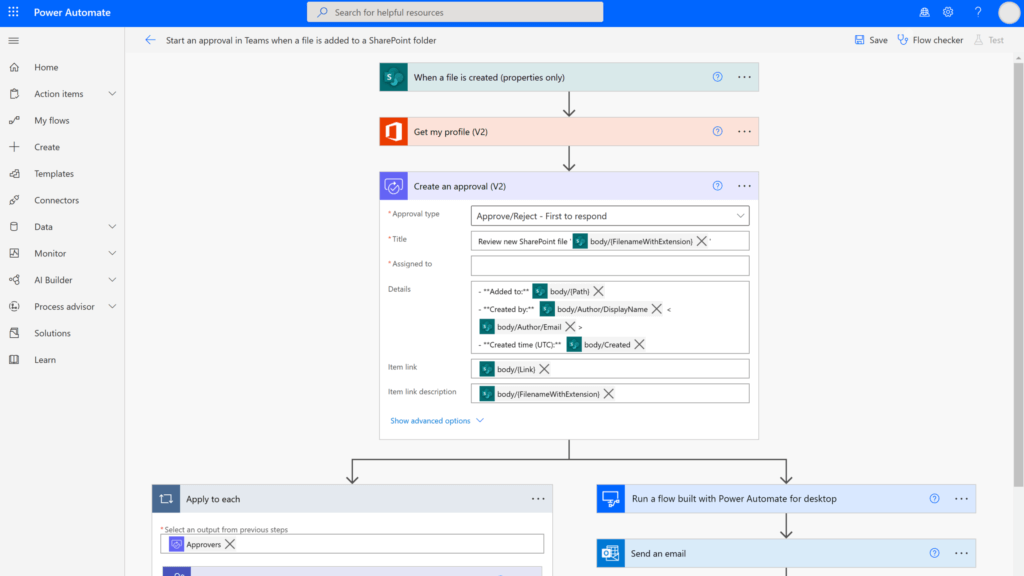
With Power Automate and its seamless integration with Dynamics 365 and Power BI, you can easily schedule and automate the delivery of reports to the right people at the right time.
This will expedite information sharing and drives collaboration for added productivity and growth. With its low code/no code features, it’s easy for users to build self-service forms and portals for customer-facing as well as internal processes. Additionally, users can effortlessly build flows to keep everyone within the organisation in the loop with contextual information and reports when needed.
Power Automate also integrates with SharePoint and Office 365 for even more seamless collaboration and improved user experience.
8. Best practices for better reporting in Dynamics 365
- Pinpoint specific data you need for the report. Determine which fields and entities you need on your report. Rely on the Excel and Power BI integration for more advanced and interactive reports.
- Monitor your reports continuously to make necessary changes based on dynamic business needs and user preferences.
- Use smaller datasets to test your reports before implementing them on your larger datasets to ensure accuracy and avoid glitches.
- Use the right reporting format based on your target audience. For instance, choose summary reports for senior management instead of detailed reports.
- Consider partnering with a trusted advisor to help you optimise reporting in Dynamics 365. This will not only allow you to save time and cost but also ensure the continuity of your daily business operations with access to uninterrupted support.
9. Get help from your trusted advisors
Configuring reports based on your business needs while also ensuring the continuity of your routine operations can be overwhelming. That is precisely why you should get assistance from trusted advisors like Dogma. We provide unbiased and transparent services ranging from expert Dynamics 365 consultation to designing bespoke reporting capabilities for businesses of sizes.
Partnering with us not only helps you unlock real-time business intelligence through advanced reporting capabilities but also ensures the optimum use of all available reporting options based on your business needs at affordable cost.


