Author: Baibhav Baidya
Turn data into insights and collaborate customized dashboards to enable fast, informed decisions. With PowerBI you can easily transform data into stunning visuals and share them with colleagues anytime on any device.
In this blog we will learn to create PowerBI report using the data from Dynamics 365. Once we complete the report we will publish it on the web, so we can utilize it anywhere on website or CRM dashboards.
Here are the steps that will guide you through the process to create PowerBI Report:
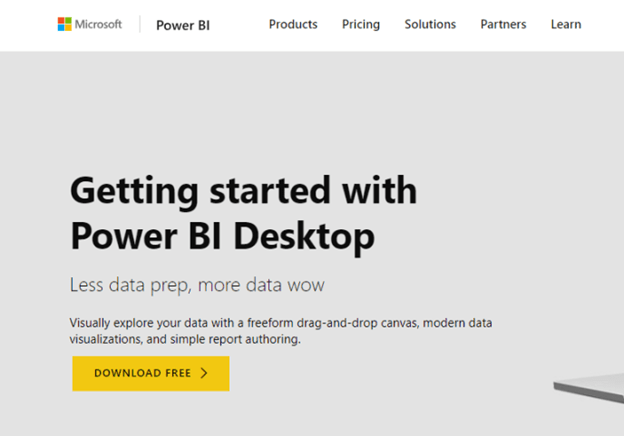
Step 1: Use this link to go to PowerBI site https://powerbi.microsoft.com/en-us

Step 2: Download the Power BI Desktop version for free trial.

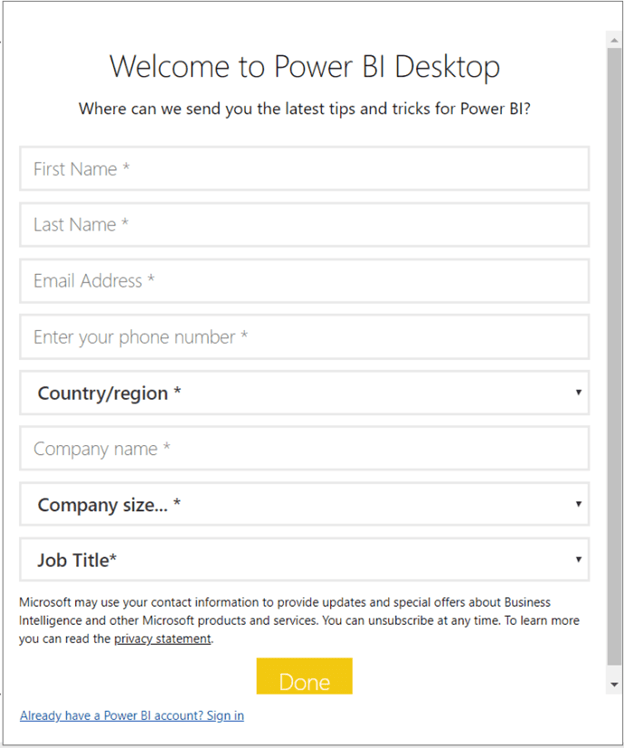
Step 3: After installation, register the user or use the existing one that you have for CRM version as free trial.

Step 4: Now the ‘Sign in’ screen will appear.

Step 5: After logging in successfully, you will see the screen below.
Now you should click on Get Data.

Step 6: After that, you will be asked to select the service provider from where you need to fetch the data. For now, we will first select Online Services and then Dynamics 365.

Step 7: Now you can extract the Web API URL from CRM. To get the Web API URL, go to Setting click on Customizations and then on Developer Resources.

Step 8: Now you can provide the above extracted CRM Web API URL in the Organization account.

Step 9: Click on the Sign in to login to CRM.

Step 10: Click on Connect to get Data from Dynamics 365 CRM

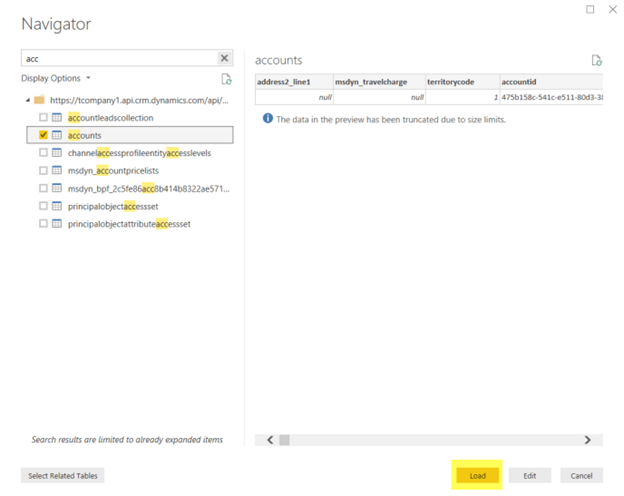
Step 11: Now you can select the entity you want to build the report for. In our case, we will select the account and then press Load.

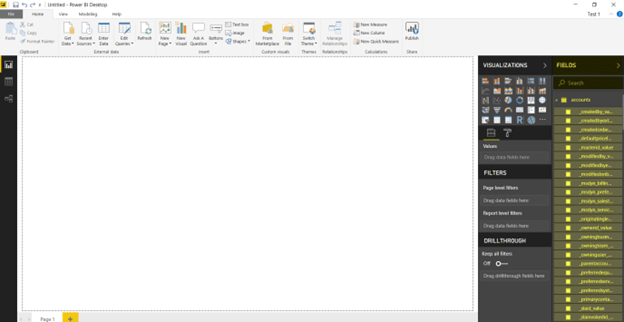
Step 12: Once loaded, you will see the screen below with fields (highlighted) that can be utilised creating the report.

Step 13: Now select the Edit Queries option to change data according to your requirements.

Step 14: Click on the Choose Columns option to select the column you want to use in the report.

Step 15: You will see the screen below where you can choose columns. For now, let’s select ‘name’ and ‘created on fields’.

Step 16: Once you choose the column you will see the result as shown below:

Step 17: Apply the changes by clicking on Close & Apply.

Step 18: Select fields and chart type from the visualization section. This will show you the desired chart result.

Step 19: Click on “Publish” in order to publish it on the WorkSpace of PowerBI.

Step 20: After successfully publishing, you can see the reports in My Workspace section under Reports.

Step 21: Open the report and click on the File menu and then you can see the option Publish to web.

Step 22: After successfully completing this step, you can see the URL that can be used to display the report in Dynamics 365.
Power BI streamlines the process of extracting and presenting data through easy drag-and-drop functionality. We will be compiling more similar blogs on other modules of PowerBI.
If you need help creating data dashboards and visualizations with Power BI, Contact us today for a no-obligation consultation on 01296 328 689. Or email us at info@dogmagroup.co.uk.


