Author: Bibek Baidya
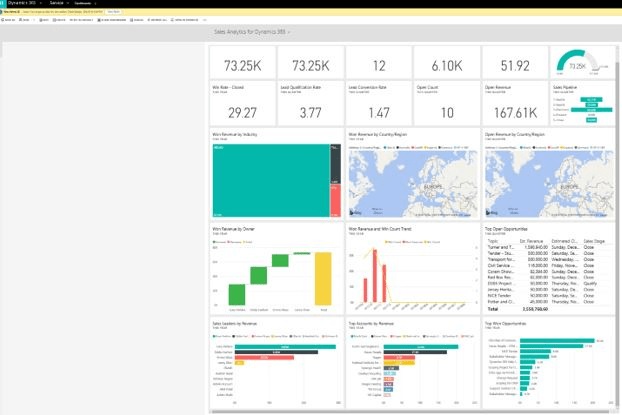
One of the best features in Dynamics 365 is the capability to insert PowerBI Reports on your dashboard. It is fast, easy, straightforward to set up, and FREE!
You can add a fully functioning pre-built Power BI dashboard to Microsoft Dynamics 365 using your own data.
Let’s understand how you can add PowerBI visualisation in your CRM dashboard:

Some essential requirements before you start creating a Dashboard:
- You need to have access to Power BI, and at least one Power BI Dashboard to reference
- Visualizations will come from a Dashboard in Power BI
- CRM Online 2016 or above
- PowerBI O365 Subscription
- Allow Power BI tile embedding set to YES
- Navigate to Settings > Administration > System Settings > the Reporting tab, then check “Allow Power BI tile embedding”
Note: Please note that you can either choose to embed the whole PowerBI Dashboard or, you can add the individual components/visuals in a dashboard.
Here are the steps you can follow to Set-up Dashboard:
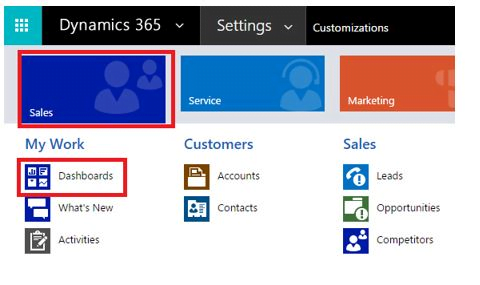
Step 1: Go to Dashboards.

Step 2: Create a new ‘Power BI Dashboard’.

Step 3: Presuming PowerBI dashboard is created and published, you must be able to view that in the dropdown menu under ‘Dashboard’.

Note: You can opt to enable this in mobile by ticking ‘Enable for Mobile’.
If you need help creating data dashboards and visualizations with Power BI, Contact us today for a no-obligation consultation on 01296 328 689. Or email us at info@dogmagroup.co.uk.


