
Are you looking to implement a business intelligence (BI) solution to unlock the full potential of your business data? Do you need trusted advice for picking the right BI tool for your organisation?
Think of BI tools as treasure maps for ambitious companies, guiding them through vast oceans of data to discover valuable insights that translate into better decisions, enhanced efficiency, and, ultimately, higher profits. However, with numerous options available, finding the perfect fit for your data-rich organisation can be overwhelming.
Enter the battle of the BI titans: Power BI and Tableau. These sought-after tools excel in data visualisation and analytics, offering powerful solutions. But which one will be your trusted companion on the path to data-driven success?
Fear not, as we’re here to assist you in making the right choice!
1. Platform
When it comes to BI platforms, you want one that promotes collaboration, supports globalisation, and allows database write-backs. So, how do Tableau and Power BI stack up?
First up, Power BI. Microsoft released Power BI in 2013, incorporating Excel-based add-ins. It offers exclusive workspaces that enable your teams to take ownership of their reports, dashboards, datasets and workbooks. These workspaces are collaborative and can be team or project-based, with role-based permissions for viewing, editing, and distributing.
Power BI supports 44 languages, enabling the localisation of menus, buttons, messages and other elements. Plus, it enables write-backs to transactional applications, making data input seamless and efficient. Notably, Gartner’s Magic Quadrant for Business Intelligence and Analytics Platform recognises Power BI as the dominant player in terms of user adoption.
Now let’s discuss Tableau. Released in 2003 and later acquired by Salesforce in 2019, Tableau is another leading data visualisation tool. It excels in beautiful graphics and allows for easy sharing of links, projects, workbooks, data sources, workflows and views, including commenting on views. Its Server and Desktop versions allow for the localisation of menus, labels, currency symbols and screen prompts in eight languages. And like Power BI, Tableau supports write-backs, enabling easy input of data to your transactional applications.
So which one should you choose? While both platforms offer similar functionality, there are some differences that may make one more suitable for your business than the other. For example, Power BI may be a better choice if you have a large team that needs to collaborate on reports and dashboards, while Tableau’s data-driven alerts may be a selling point for businesses that rely on real-time updates.
2. Dashboards and Visualisations
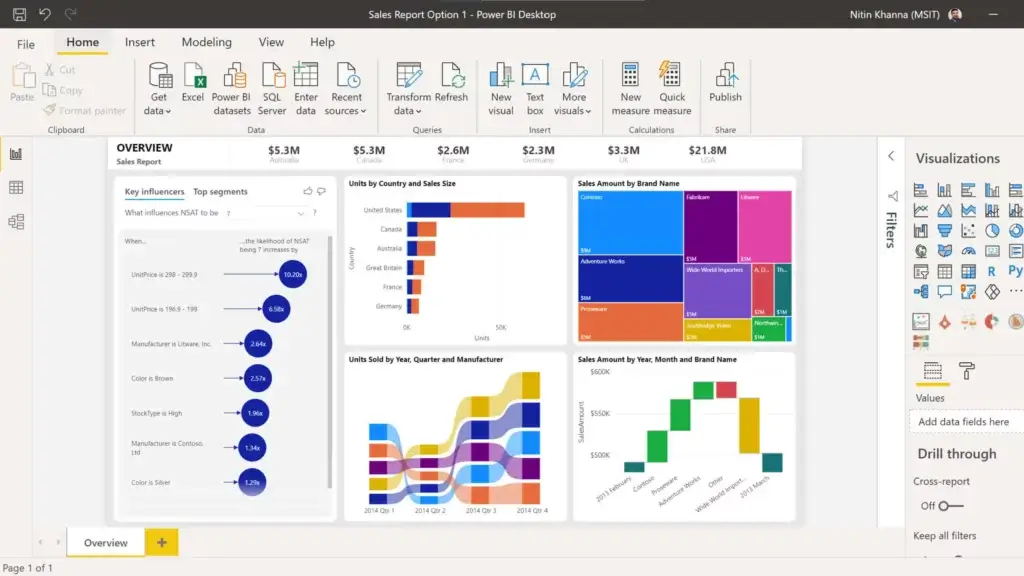
Power BI excels in data visualisation, offering concise graphical reports for a swift overview of your metrics and datasets. You can also easily pin important reports to your customisable dashboard and set up alerts to stay on top of specific metrics. Although Power BI lacks built-in dashboard templates, you can effortlessly access them via template apps.
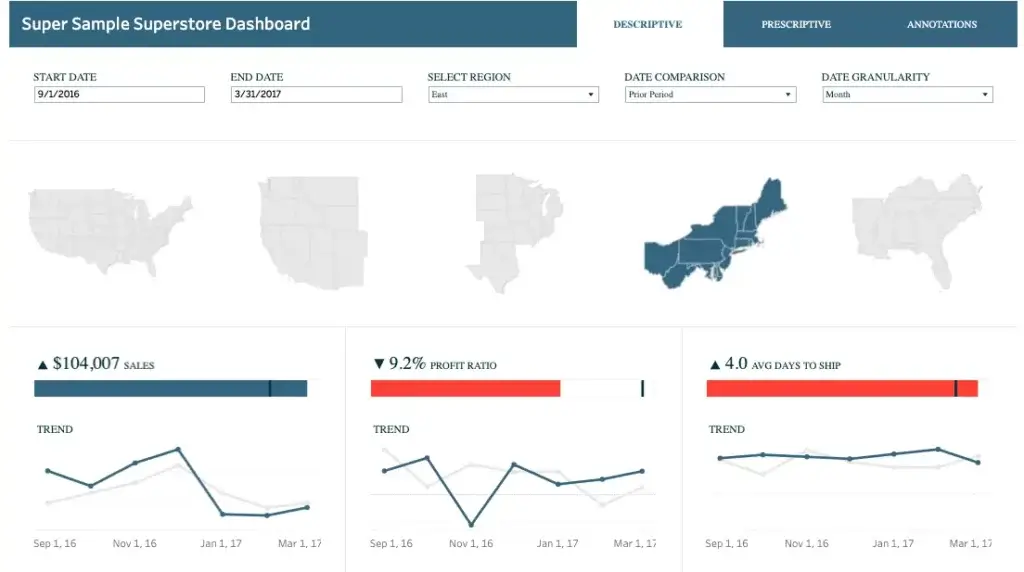
On the other hand, Tableau provides instant data visualisation through its Dashboard Starters. Choose to create your own visualisations from scratch or download and duplicate ones crafted by the Tableau community. Elevate your visual presentations with Tableau’s impressive built-in animations library.
Furthermore, Tableau provides boundless creativity, empowering users with unparalleled customisation options to craft captivating visualisations and dashboards. Its reputation precedes it, as Tableau excels in providing a canvas where every detail can be finely tuned to match your unique vision. On the other hand, Power BI offers some customisation capabilities, albeit more restrained compared to the limitless possibilities unleashed by Tableau.
Choosing between the two depends on your specific needs and preferences. If you seek a tool for swiftly creating graphical reports and dashboards, Power BI is definitely worth exploring. However, if you desire greater control over your visualisations and are willing to invest more effort, Tableau may be your ideal choice.
3. User Interface
As for the user interface, while both Tableau and Power BI have good user interfaces, Power BI is known more for its simplicity and ease of use.
Compared to Tableau, Power BI has a more intuitive interface, making it easier to learn, use, and connect to other Microsoft products. You can create new columns, modify data, and change formats with ease. Power BI also focuses on the “flow” to provide a smooth and consistent user experience.
On the contrary, Tableau focuses on coding to provide you with new visual effects. That means it has a steeper learning curve, so new users may experience a rougher start and need some time to get the hand of it. In Tableau, you can alter data type and split columns, but you cannot remove unnecessary columns.
Additionally, Power BI offers PowerPivot dots, which make data analysis more efficient and accessible for users. Tableau, however, does not provide this feature.
So, while Tableau is more suited for advanced users who are comfortable with coding, Power BI’s simplicity and ease of use make it a popular choice for businesses of all sizes.
4. Product and Pricing
Pricing models and product variations may be one of the key distinctions between Power BI and Tableau.
Power BI offers three per-user licences: Free, Pro, and Premium. The Free version is for personal use, limiting collaboration and content publishing. The Pro version costs £8.20 per user per month, while the Premium edition is £16.40 per user per month. But Power BI Pro is popular with organisations as it is bundled with Microsoft 365 E5 licence. These models suit small to medium-sized organisations and those with limited users. For businesses with several Power BI users, the Premium licence allows enterprise-scale data management, starting at £4,105.60 per capacity per month. What’s more, Power BI provides flexible entry for users of any size or need, available on desktop, cloud, web, and mobile devices (excluding Apple computers).
Tableau also offers desktop, cloud, and mobile options for real-time data management. It has three versions: Creator, Explorer, and Viewer. Tableau Creator, costing £56 per user per month, includes Tableau Desktop, Prep Builder, and one Creator licence for Tableau Cloud. Tableau Explorer, priced at £34 per user per month, has one Creator licence for Tableau Cloud. Lastly, Tableau Viewer offers one Viewer licence on Tableau Cloud for £12 per user per month. These pricing structures cater to different user roles but can be complex and expensive for larger organisations.
In summary, Power BI offers a pricing structure that is favourable for organisations of all sizes and user count as opposed to Tableau, which has a pricing model that is more favourable for small and medium businesses.
5. Data Management Capabilities
Tableau and Power BI provide comprehensive data management capabilities, including consolidation, cleansing, transformation, and analysis. Power BI offers Power Query, Power Pivot, Power View, Power Map, and Power Q&A. Power Query efficiently connects, combines, and transforms data from multiple sources. Power Pivot creates reusable data models with editable metrics. Power View generates interactive graphs, charts, maps, and visuals, while Power Map creates immersive 3D visuals. Power BI’s question-and-answer engine provides natural language answers to data queries.
Tableau offers Tableau Catalog, Prep Builder, Prep Conductor, Virtual Connections, and Data Policies for data management. Catalog indexes and gathers metadata for Tableau data assets, enabling advanced capabilities such as data discovery, curation, impact analysis, and lineage tracking. Prep Builder allows workflow design, including field renaming, data filtering, and type changes. Prep Conductor handles workflow scheduling, publishing, and monitoring. Virtual Connections facilitate secure data sharing, and Data Policies define row-level security.
While both platforms have robust data management components and capabilities, note that Power BI has a limited capacity of 1 GB for its free version and 10 GB for the Pro edition. It comes with a per-workspace with 10 GB, and Premier per-user tenants get a 100-TB storage limit. As for the Pro licence, the storage limit is 10 GB per-tenant times the number of Pro licences in the tenant. Conversely, Tableau Server (on-premise) comes with unlimited storage, and Tableau Cloud comes with a 100 GB storage limit for workbooks and extracts.
To sum up, it’s worth mentioning that Power BI has limited storage capacity compared to Tableau. Thus, Tableau suits large organisations dealing with substantial data volumes, while Power BI is ideal for small and medium enterprises with smaller databases.
6. Integrations
When it comes to connecting to data sources and data pipelines, both Tableau and Power BI offer extensive capabilities. They can accept data from various sources, including spreadsheets, SQL databases, and cloud platforms, making them highly versatile. These tools provide options for the Extract Transform Load (ETL) process, allowing users to transform their data and make it usable within the applications.
Power BI utilises Power Query, which is similar to Excel, enabling users to easily transform and load data within the application itself. However, complex data relationships and structures can consume significant memory and slow down Power BI.
On the other hand, Tableau takes a different approach. It requires data to be clean and pre-processed before application, although relationships can be established. For more extensive transformations and ETL processes, users can utilise Tableau Prep Builder to achieve clean data integration into Tableau.
So, the choice comes down to this: Power BI comes in handy when you’re working with less complex data or when you’re already using other Dynamics 365 and Microsoft 365 applications as data sources. But if you are working with complex data and relationships, Tableau can be a live saver.
7. Enterprise Reporting Capabilities
Tableau and Power BI are powerful analytics tools, but what sets them apart? Let’s explore their standout features.
Power BI excels in insight-sharing with its Report Server, ensuring robust governance behind a firewall. It offers hosting for various reports, including paginated, mobile, and Power BI Desktop reports. Users can easily modify reports created by the development team. With permission management and role-based access, data security is guaranteed. Subscribing to scheduled automatic report delivery is also available. The built-in AI enhances reports with Key Influencers, Decomposition Tree analysis, Dataflows, Power Query, Q&A, Quick Insights, and Cognitive Services.
Tableau introduces the game-changing Ask Data module, allowing faster data analysis through text querying. Versioning enables tracking of report changes, a feature absent in Power BI. In addition, Tableau’s subscription service offers reports via email in image or PDF format.
Both tools have unique strengths. Power BI excels in secure insights sharing, automated report delivery, and AI-powered reporting. Conversely, Tableau stands out in data analysis with text queries and version tracking. That can make selecting one of these BI solutions a bit tricker, which is precisely why you need to talk to our BI experts at Dogma.
8. AI and ML-Driven Analytics
If you are looking for a data visualisation tool that can provide you with quick and accurate insights, Tableau and Power BI can both come in handy. Both these tools offer powerful augmented analytics features, such as AI, deep learning, and machine learning, to drive quicker query results.
Power BI’s AutoML module effortlessly trains analysis models, while the Quick Insights module uncovers correlations, outliers, and basic insights. On the other hand, Tableau’s Insight Advisor delivers context-aware suggestions, answering your questions in everyday language and presenting results in captivating graphics. Enjoy detailed explanations by simply hovering over data points. Nevertheless, Tableau has its limitations. It lacks automated algorithms, feature selection, contextual insights, key driver analysis, and voice search.
The bottom-line is both Tableau and Power BI boast impressive, augmented analytics features, each with unique strengths. Power BI excels in automated machine learning and rapid insights, while Tableau thrives in context-aware suggestions and comprehensive explanations.
9. Mobile BI Functionalities
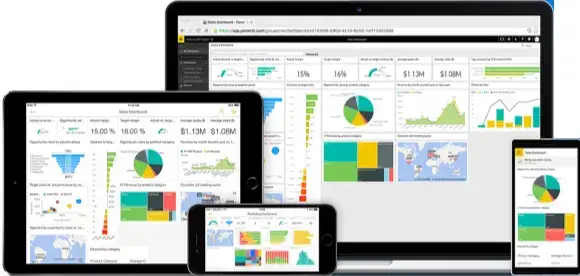
Looking to take your data analysis on the go? Power BI and Tableau both enable mobile BI, but which is the right choice for you?
Power BI offers a user-friendly mobile app that allows you to create and access reports and dashboards on the go. Plus, you can easily share insights, collaborate with colleagues, and set alerts. With the ability to annotate, comment, and @mention others, you can keep everyone in the loop no matter where you are.
Tableau also offers a mobile app for browsing, searching, and scrolling through dashboards. You can even preview visualisations and workbooks before sharing and interact with them offline if needed. However, it’s worth noting that the Tableau mobile app is only available for Tableau Server or Online account holders. If you’re using Tableau Public, you’ll need to access it via a web browser. It also doesn’t support mobile collaboration, so you won’t be able to collaborate with colleagues on the go. Additionally, it doesn’t offer geospatial analysis or scanning machine-readable codes.
In conclusion, Power BI may be the better choice compared to Tableau if you value mobile collaboration and need geospatial analysis or scanning capabilities. However, if you’re already a Tableau Server or Online user and don’t require these features, the Tableau mobile app is a solid choice.

10. Data Querying
When it comes to data querying, Power BI and Tableau both excel in providing high-speed queries through in-memory analysis. However, each product has its unique strengths that set them apart from each other.
Power BI allows you to create up-to-date reports with live connections to shared datasets and models. The Query Editor gives you access to over 350 capabilities, such as renaming tables and columns, removing rows and setting the first row as headers. Additionally, Power BI leverages bulk operations functionality for batch updates, making it a great choice for handling large amounts of tasks.
On the other hand, Tableau’s visual query language, VizQL, allows you to query business assets intuitively. If you know SQL, you can also append, combine and aggregate specific datasets. Tableau allows you to create custom live connections and share them on the Tableau server for others to use. While Tableau offers moderate support for multi-pass SQL, Power BI doesn’t support it.
Considering these data querying capabilities, It’s important to note that both Power BI and Tableau have their own strengths and weaknesses. Your choice should depend on your specific requirements, data needs and budget.
So, What’s the Verdict?
A brief consultation with a professional technology partner can help you understand the scope of your BI journey, which can go a long way toward making your next BI project a success. At Dogma, we provide BI consultation to help you jumpstart the process of gaining more value from data and enable informed, real-time decision-making. We have helped several of our clients globally to achieve their data management and reporting needs and drive growth. You can be next!